- TA Capital Research
- Posts
- TA Market Recap
Table of Contents
Market Snapshot
S&P 500 Heatmap Last Week

Market Highlights
Indices closed the week mostly lower
Russell 2000 was the only one of the major indices to close green
Volatility continues to drop, with VIX closing the week down -21%
Index | Last Week’s Performance | YTD Performance |
|---|---|---|
S&P 500 (SPX) | -1.50% | -10.18% |
Nasdaq 100 (NDX) | -2.31% | -13.11% |
Russell 2000 (RUT) | +1.10% | -15.67% |
Dow Jones Industrial Average (DJI) | -2.66% | -8.00% |
Best/Worst S&P 500 Equities Last Week
Best
LLY: +14.68%
DLTR: +9.75%
APA: +7.11%
HPE: +7.07%
FANG: +6.69%
Worst
UNH: -24.25%
GPN: -18.24%
HUM: -10.36%
DA: -9.95%
META: -7.74%
Sector Performance Last Week

*For a full breakdown of sector performance, our clients receive in-depth analysis within our weekly Sector Rotation Report
Technical Analysis Brief
Each week, we review the S&P 500 (in order to provide a consistent, technical narrative for the overall market), as well as a select equity and an asset from the broader market.
S&P 500: $SPX | daily
Strong bounce off of the ~4,800 level that we shared with our clients weeks ago, but now struggling a bit as price ran into some resistance around the ~5,500 pivot and the descending 20 day MA.

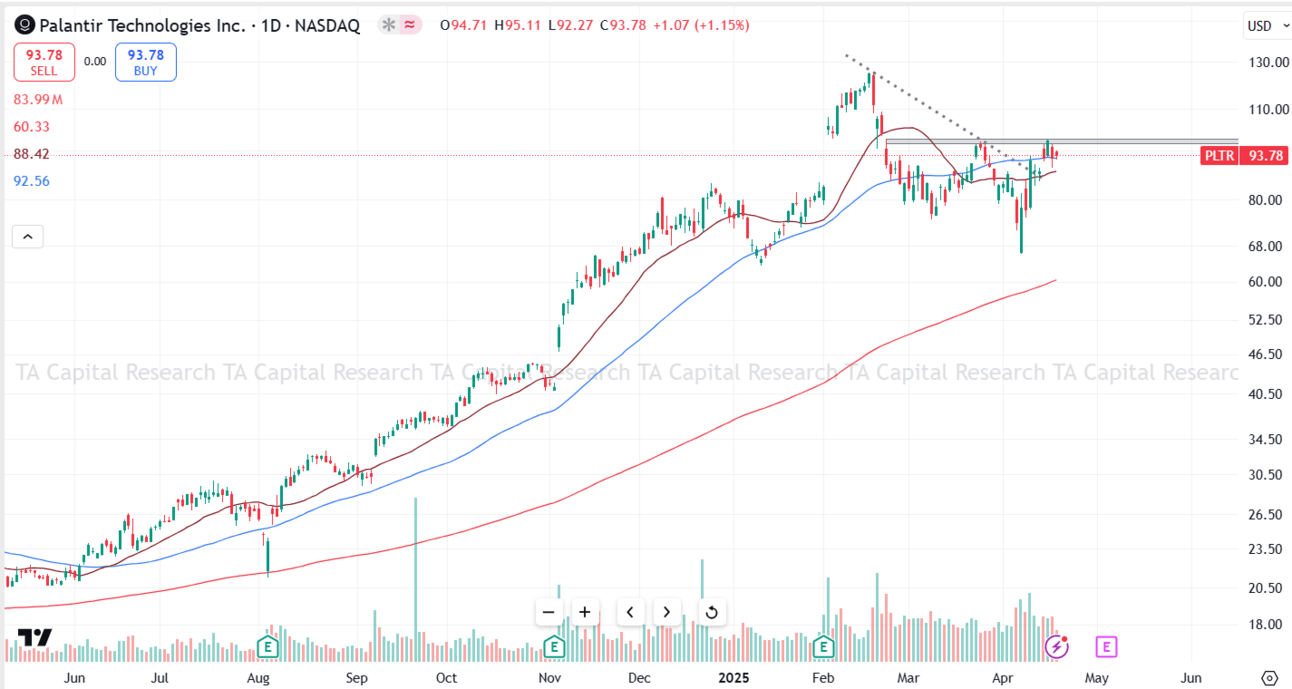
Palantir Technologies Inc: $PLTR | daily
This hart held up very well considering the pullback we saw within the major indices to close out the week. Strength over ~$97 could bring in some strong buying.
Gold | daily
Continuing to trend higher over the 20/50 day MAs since we noted the triangle breakout with clients. Strong bounce off of the ~$2,950 pivot retest, as well.

*For updated analysis on the financial markets, our clients receive in-depth analysis DAILY within our weekly Market Analysis Report
TA Capital Research Performance
We continue to help our clients successfully navigate this volatile market in 2025. Below are our model portfolios, and the YTD performance for each:

If you are interested in trying TA Capital Research for free, we would love the chance to work with you! You can visit TACapitalResearch.com/Plans to learn more.
The information and analysis provided in this report are for informational purposes only and should not be construed as investment advice or a recommendation for any specific investment strategy, product, or service. Past performance is not indicative of future results, and all investments carry risks, including the potential loss of principal. TA Capital Research makes no representations or warranties regarding the accuracy or completeness of the information presented and does not assume any responsibility for any decisions made based on this report.
Reply