- TA Capital Research
- Posts
- TA Market Recap
Table of Contents
Market Snapshot
S&P 500 Heatmap Last Week
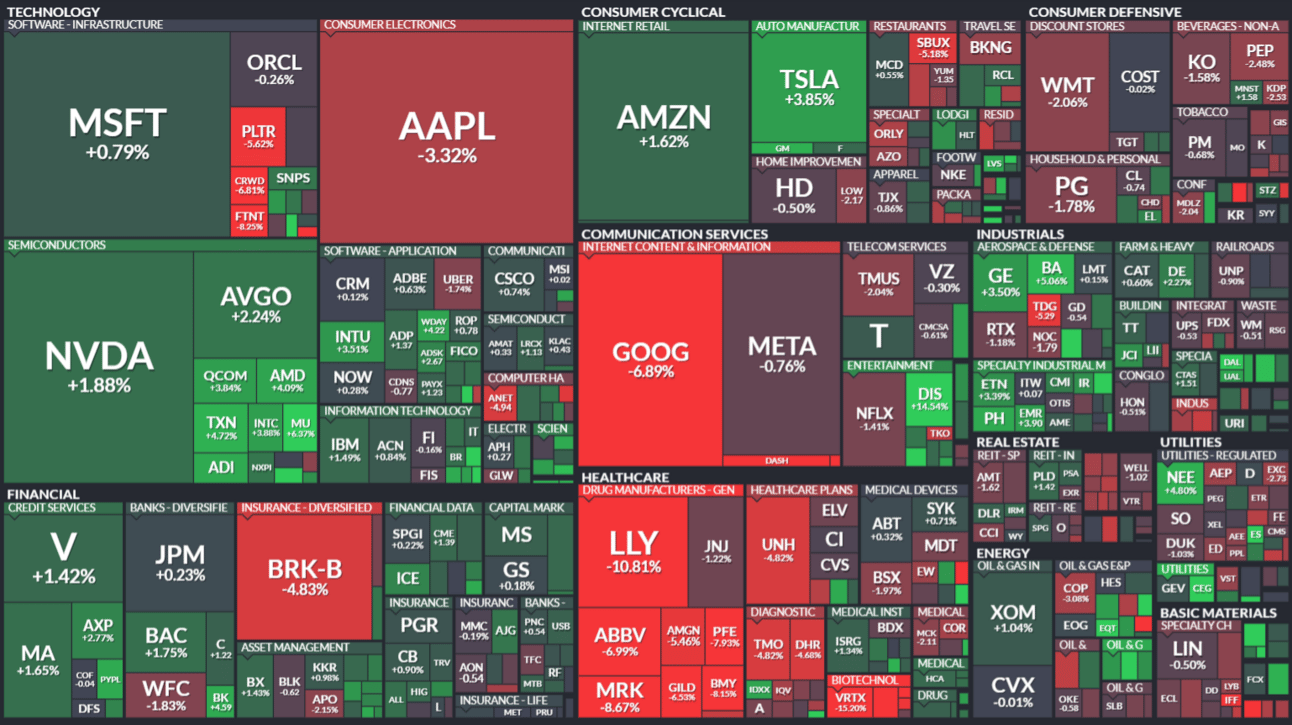
Market Highlights
Indices closed mostly flat last week
The Russell 2000 was the only index to close green
Indices remain red YTD
Index | Last Week | YTD |
|---|---|---|
S&P 500 (SPX) | -0.47% | -3.77% |
Nasdaq 100 (NDX) | -0.20% | -4.52% |
Russell 2000 (RUT) | +0.12% | -9.29% |
Dow Jones Industrial Average (DJI) | -0.16% | -3.04% |
Best/Worst S&P 500 Equities Last Week
Best
Ticker | Last Week | YTD |
|---|---|---|
$PODD | +20.88% | +19.00% |
$CRL | +17.16% | -24.82% |
$ROK | +16.22% | +3.15% |
$MCHP | +15.49% | -3.52% |
$DIS | +15.44% | -4.86% |
Worst
Ticker | Last Week | YTD |
|---|---|---|
$VRTX | -15.20% | +5.54% |
$REGN | -12.85% | -25.91% |
$MRNA | -12.17% | -41.68% |
$MTCH | -11.44% | -16.91% |
$LLY | -10.81% | -4.85% |
Sector Performance Last Week

*For a full breakdown of sector performance, our clients receive in-depth analysis within our weekly Sector Rotation Report
Technical Analysis Brief
Each week, we review the S&P 500 (in order to provide a consistent, technical narrative for the overall market), as well as a select equity and an asset from the broader market.
S&P 500: $SPX | daily
The bounce continues here since we shared the ~4,800 long term support test with clients at the April lows. Now, this is coming into some pretty big resistance with the 200 day MA and the 5,770-5,790 pivot above. The trend remains higher, but we are proceeding with caution short term — strength over ~5,800 really opens this chart up, however.

Walt Disney Company: $DIS | monthly
Incredible bounce within this chart since we noted the $78-$81 long term support test with our clients at the April lows. So far, we have seen a +35% bounce — but price remains stuck within this 3-year consolidation between $78-$120.

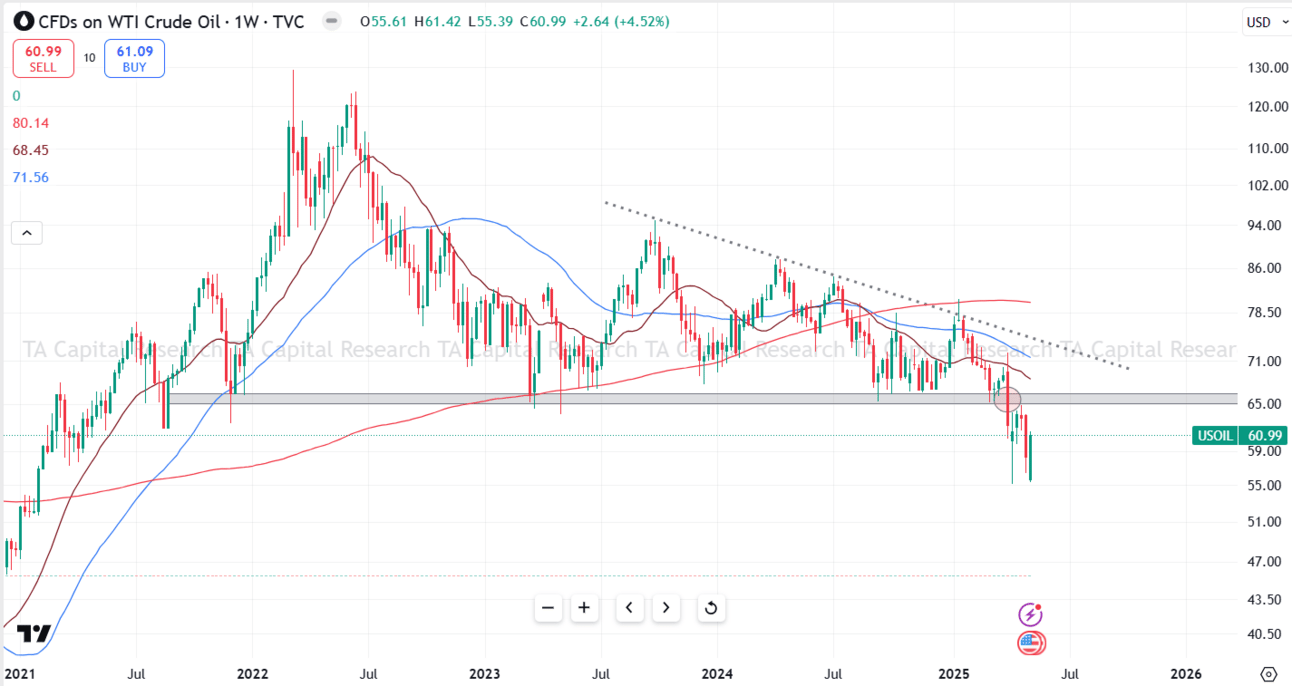
WTI Crude Oil: $USOIL | weekly
+4.52% last week, but still trading below a very important pivo level. If we do see continuation from last week’s strength, the important level to continue to monitor is the $65-$67 pivot above (previously broken support).
*For updated analysis on the financial markets, our clients receive in-depth analysis DAILY within our weekly Market Analysis Report
TA Capital Research Performance
We continue to help our clients successfully navigate this volatile market in 2025. Below are our model portfolios, and the YTD performance for each:

In addition to our Model Portfolio and consistent Research Reports, we provide our clients with daily Premium Watchlists — as well as chart alerts when these setups breakout. Attached is the YTD performance of our Premium Watchlist Chart Alerts through March 2025.
* Chart alerts are considered “live” for 4-weeks after the initial alert
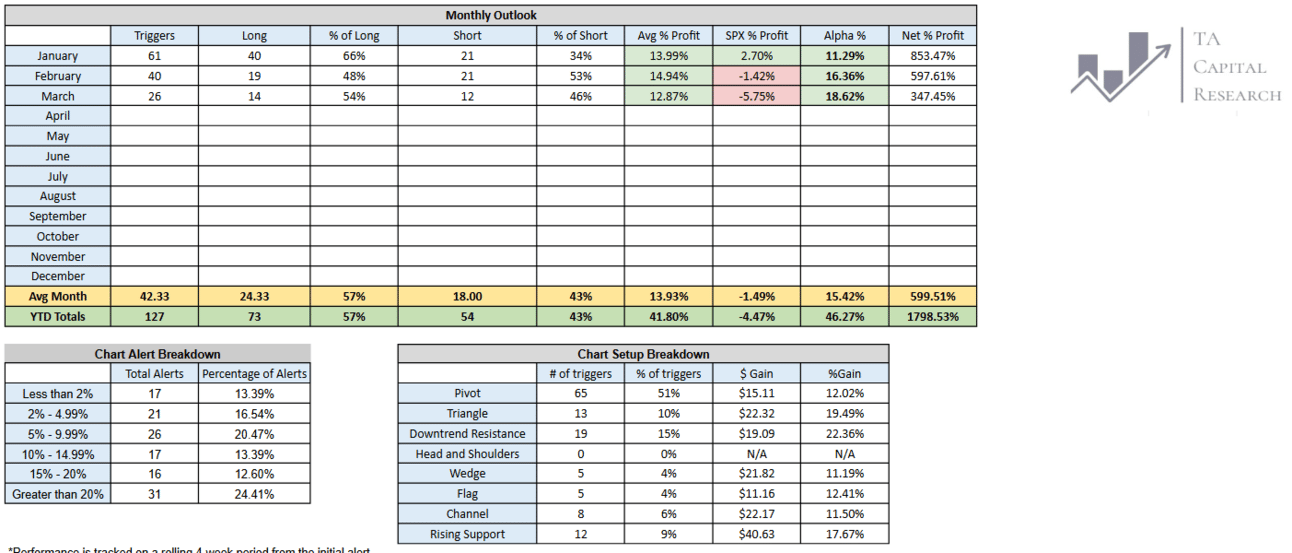
Key Takeaways:
Outperforming the S&P 500 by an average of 15.42% per month
Net profit of ~1,800% on the year
70.87% of our alerts have provided a 5%+ move higher
50.39% of our alerts have provided a 10%+ move higher
If you are interested in trying TA Capital Research for free, we would love the opportunity to work with you! You can visit TACapitalResearch.com/Plans to start your free trial.
The information and analysis provided in this report are for informational purposes only and should not be construed as investment advice or a recommendation for any specific investment strategy, product, or service. Past performance is not indicative of future results, and all investments carry risks, including the potential loss of principal. TA Capital Research makes no representations or warranties regarding the accuracy or completeness of the information presented and does not assume any responsibility for any decisions made based on this report.
Reply