- TA Capital Research
- Posts
- TA Market Recap
Table of Contents
Market Snapshot
S&P 500 Heatmap Last Week

Market Highlights
Flat week for the indices
Nasdaq continues to lead YTD
Russell continues to underperform
Index | Last Week | YTD |
|---|---|---|
S&P 500 (SPX) | -0.15% | +1.47% |
Nasdaq 100 (NDX) | -0.02% | +2.92% |
Russell 2000 (RUT) | +0.42% | -5.42% |
Dow Jones Industrial Average (DJI) | +0.02% | -0.79% |
Best/Worst S&P 500 Equities Last Week
Best
Ticker | Last Week | YTD |
|---|---|---|
$COIN | +27.93% | +24.20% |
$JBL | +15.14% | +43.29% |
$BG | +10.84% | +9.80% |
$KR | +10.62% | +17.69% |
$EQT | +8.86% | +31.08% |
Worst
Ticker | Last Week | YTD |
|---|---|---|
$ENPH | -19.79% | -47.80% |
$FSLR | -13.60% | -17.73% |
$ACN | -10.30% | -18.88% |
$ANET | -9.94% | -21.97% |
$AES | -9.79% | -19.11% |
Sector Performance Last Week

*For a full breakdown of sector performance, our clients receive in-depth analysis within our weekly Sector Rotation Report. View our latest report HERE
Technical Analysis Brief
Each week, we review the S&P 500 (in order to provide a consistent, technical narrative for the overall market), as well as a select equity and an asset from the broader market.
S&P 500: $SPX | daily
Pulling back to test the 5,960-5,970 pivot and rising 20 day MA — current short term support levels we are monitoring. If broken, we could see additional selling pressure into the 200/50 day MAs and 5,770-5,790 pivot below. Current resistance is ~6,150.

Coinbase Global, Inc: $COIN | daily
We shared the chart alert with our clients on the downtrend resistance breakout within this chart last week. So far, this setup has provided a +20% move higher for us — now clearing some pivot resistance. If this can hold over ~$300, then there is room into ~$340 next.

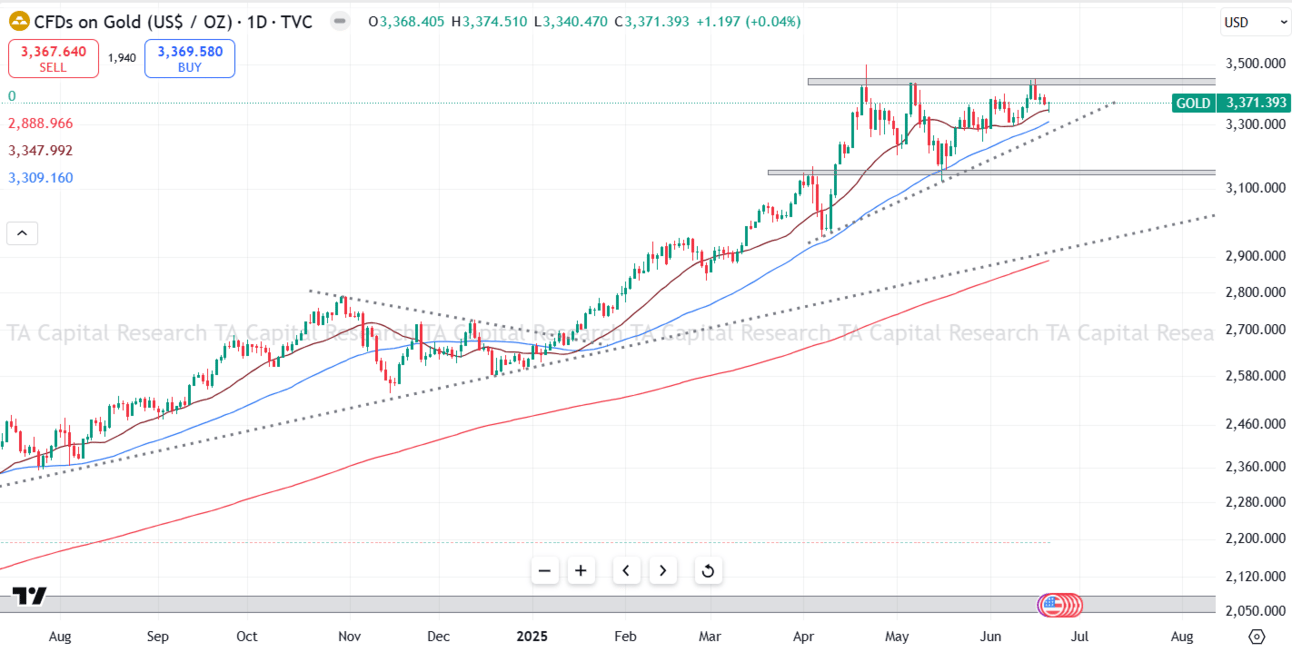
Gold | daily
Trending higher into pivot resistance, with current support being the rising support + rising 20/50 day MAs. Strength over ~$3,450 gives this chart the next leg higher. If this slips below support levels, then the next important level within this chart is the ~$3,150 pivot below.
*For updated analysis on the financial markets, our clients receive in-depth analysis DAILY within our TA Market Prep. View our latest report HERE
TA Capital Research Performance
We continue to help our clients successfully navigate this volatile market in 2025. Below is the YTD performance for each of our model portfolios:
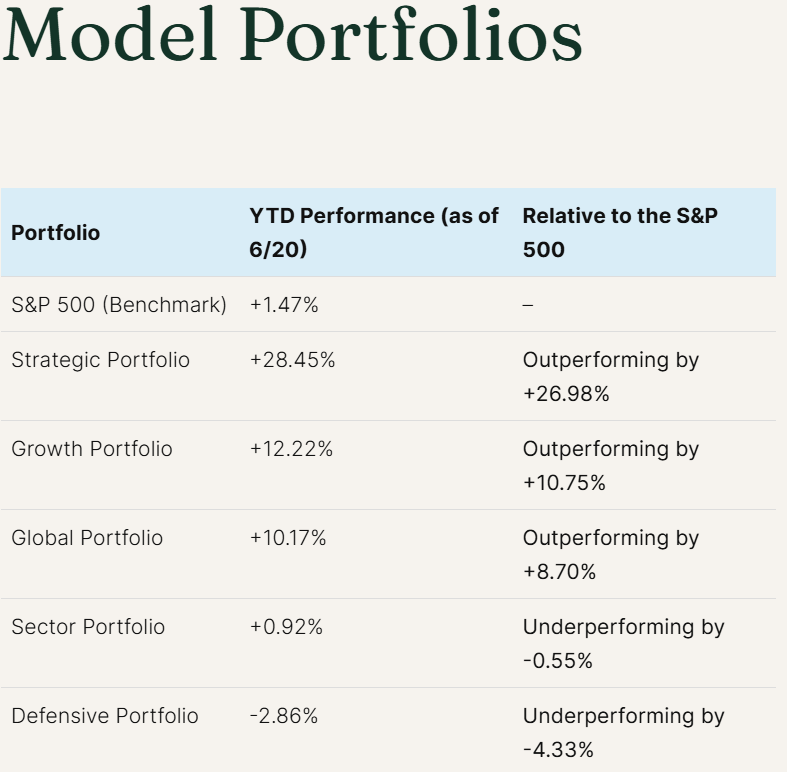
Our model portfolios continue to help our clients successfully navigate the market — outperforming the S&P 500 by ~27%.
In addition to our Model Portfolio and consistent Research Reports, we provide our clients with daily Premium Watchlists — as well as chart alerts when these setups breakout.
Attached is the YTD performance of our Premium Watchlist Chart Alerts through April 2025.
* Chart alerts are considered “live” for 4-weeks after the initial alert
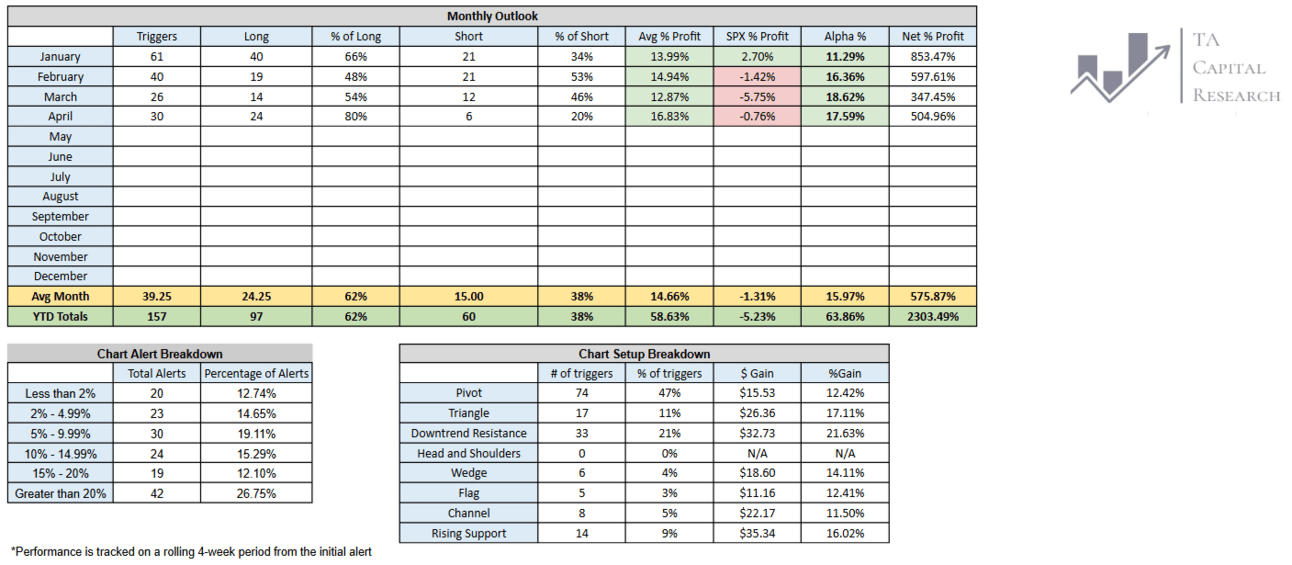
Key Takeaways:
Outperforming the S&P 500 by an average of ~16% per month
Net profit of 2,303.49% on the year
73.25% of our alerts have provided a 5%+ move higher
54.14% of our alerts have provided a 10%+ move higher
If you are interested in trying TA Capital Research for free, we would love the opportunity to work with you! You can start your free trial HERE
The information and analysis provided in this report are for informational purposes only and should not be construed as investment advice or a recommendation for any specific investment strategy, product, or service. Past performance is not indicative of future results, and all investments carry risks, including the potential loss of principal. TA Capital Research makes no representations or warranties regarding the accuracy or completeness of the information presented and does not assume any responsibility for any decisions made based on this report.
Reply