- TA Capital Research
- Posts
- TA Market Recap
Table of Contents
Market Snapshot
S&P 500 Heatmap Last Week
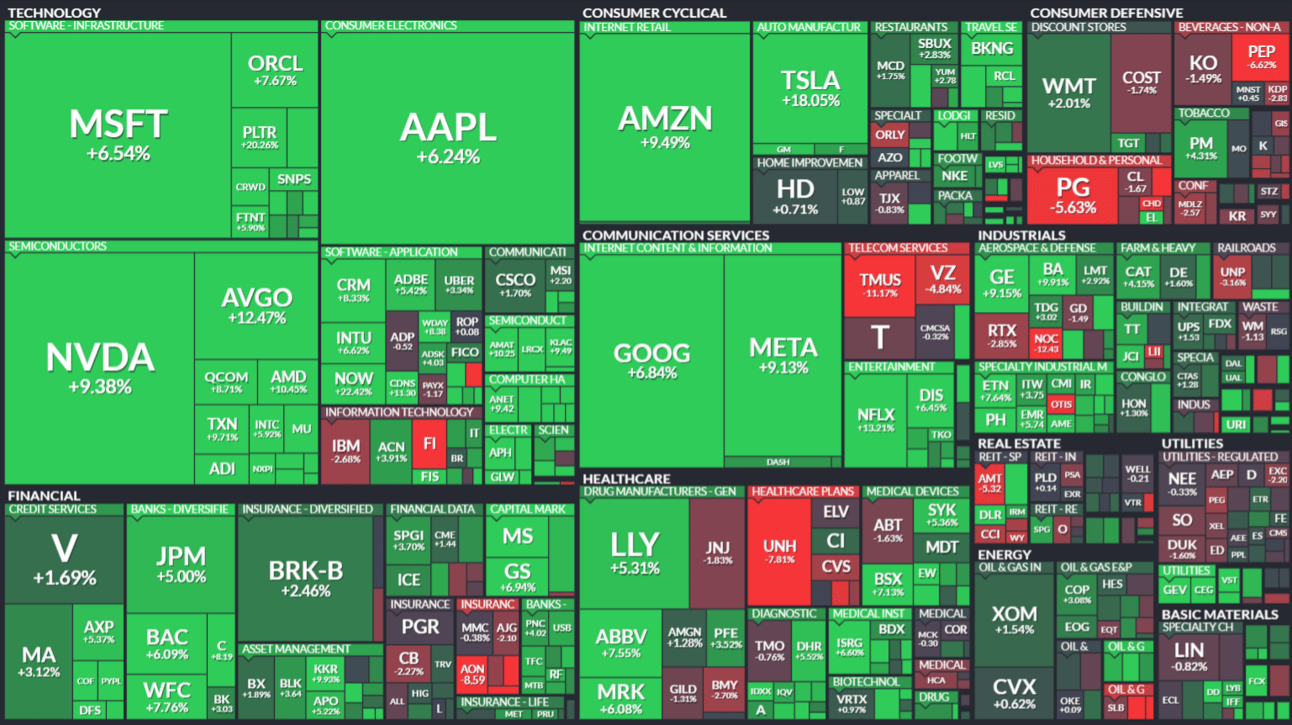
Market Highlights
Indices closed the week higher
Nasdaq lead all indices higher with a +6.43% performance last week
Volatility continues to drop, with VIX down ~60% off of April’s high
Index | Last Week | YTD |
|---|---|---|
S&P 500 (SPX) | +4.59% | -6.06% |
Nasdaq 100 (NDX) | +6.43% | -7.52% |
Russell 2000 (RUT) | +4.09% | -12.22% |
Dow Jones Industrial Average (DJI) | +2.48% | -5.71% |
Best/Worst S&P 500 Equities Last Week
Best
Ticker | Last Week | YTD |
|---|---|---|
$NOW | +22.42 | -10.83% |
$MCHP | +21.60 | -18.24% |
$PLTR | +20.26% | +49.12% |
$TSLA | +18.06% | -29.44% |
$APH | +16.58% | +9.22% |
Worst
Ticker | Last Week | YTD |
|---|---|---|
$FI | -14.92% | -13.58% |
$NOC | -12.43% | +0.83% |
$ERIE | -11.95% | -12.22% |
$TMUS | -11.17% | +5.45% |
$LKQ | -10.99% | +1.80% |
Sector Performance Last Week

*For a full breakdown of sector performance, our clients receive in-depth analysis within our weekly Sector Rotation Report
Technical Analysis Brief
Each week, we review the S&P 500 (in order to provide a consistent, technical narrative for the overall market), as well as a select equity and an asset from the broader market.
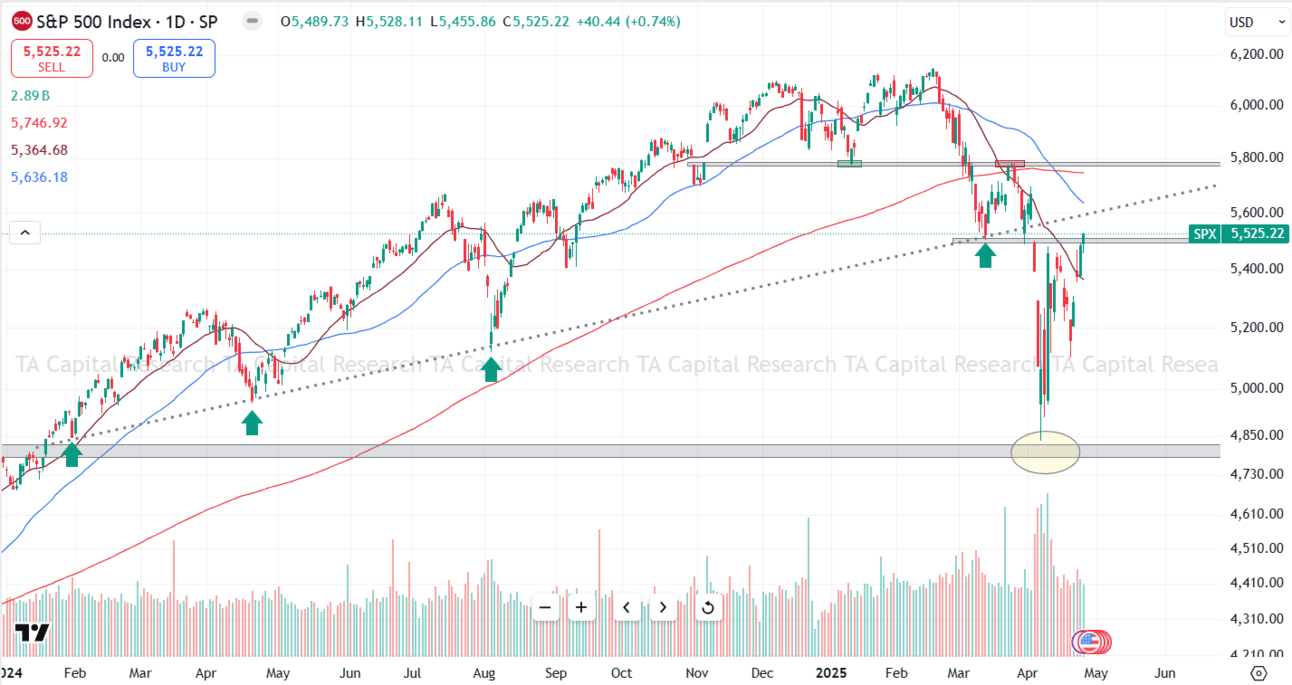
S&P 500: $SPX | daily
Strong bounce off of the ~4,800 level that we shared with our clients weeks ago, and now reclaiming this short-mid term pivot resistance around ~5,500. Price remains below some important levels, however: previously broken rising support AND 50/200 day SMAs.
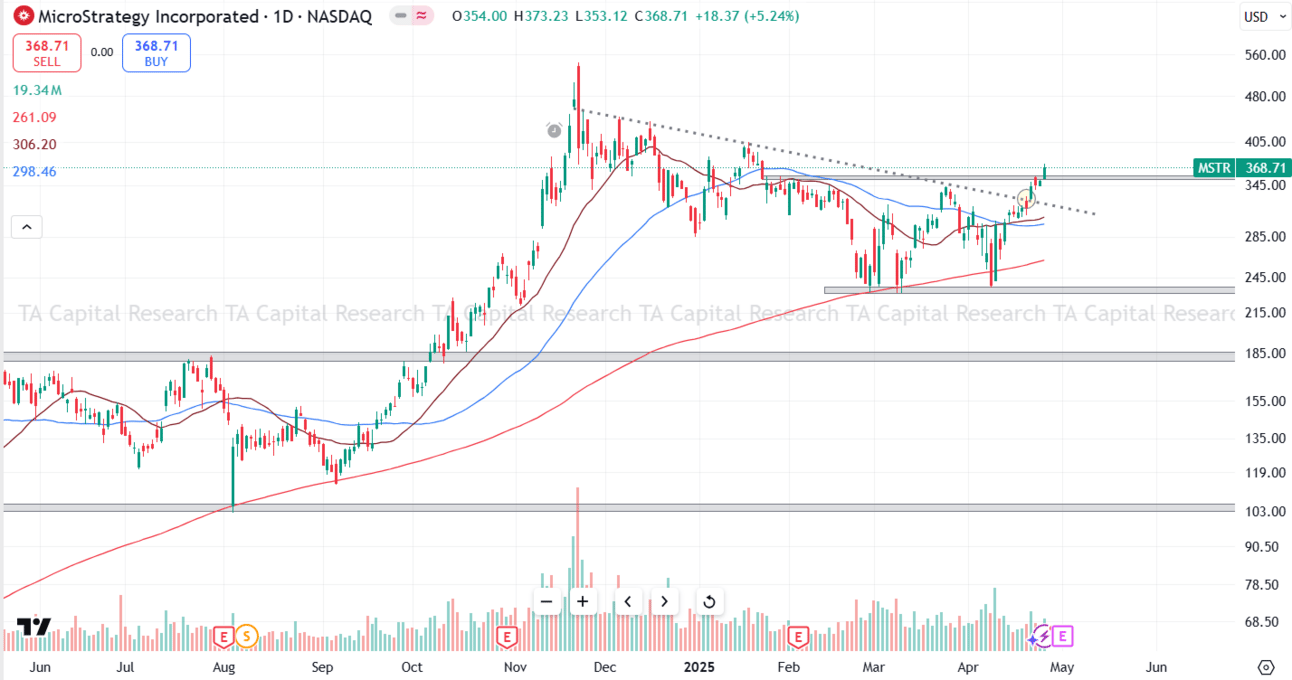
MicroStrategy Incorporated: $MSTR | daily
We shared the chart alert with our clients on the downtrend resistance breakout recently. Since the, we continued to note the importance of this ~$355 pivot resistance level. This closed out the week with a pivot breakout, and there is room for continuation into ~$400 next. This chart continues to pay off for our clients.
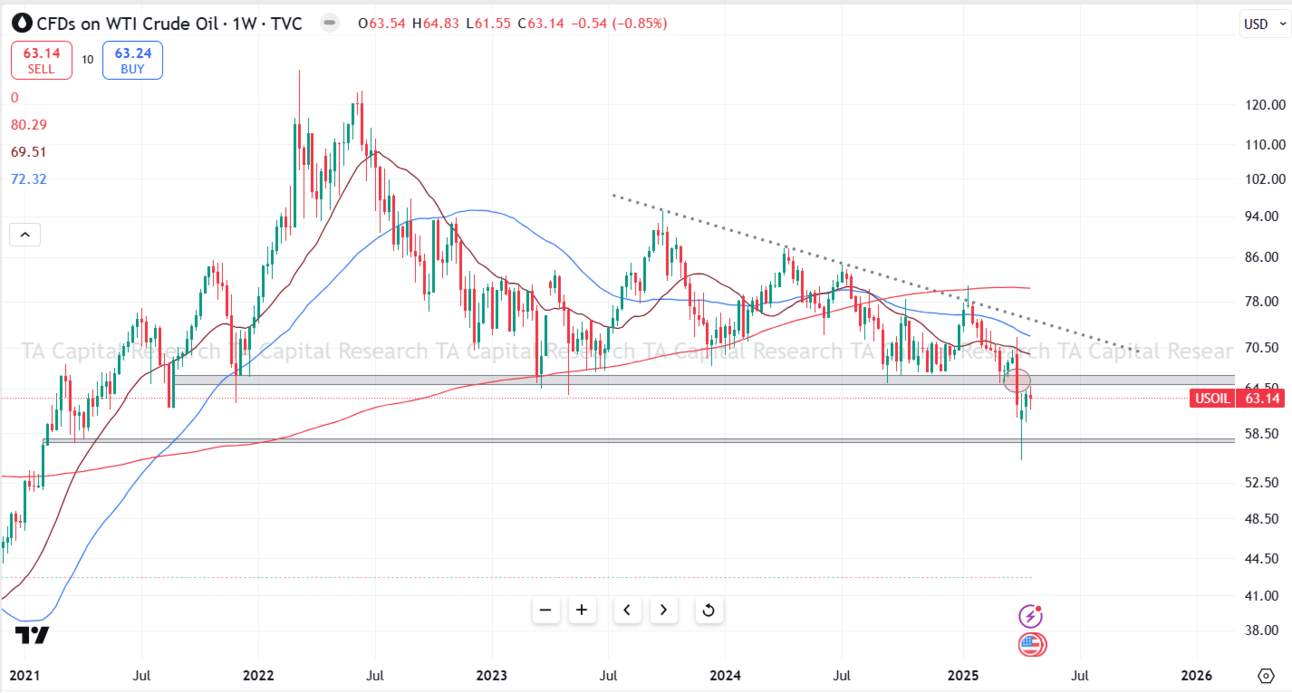
WTI Crude Oil: $USOIL | weekly
We noted out bearish bias with clients on the $65-$67 pivot support break weeks ago. This came very close to a retest of that previously broken pivot support last week. For now, our bearish bias remains here — so long as price remains below the pivot above.
*For updated analysis on the financial markets, our clients receive in-depth analysis DAILY within our weekly Market Analysis Report
TA Capital Research Performance
We continue to help our clients successfully navigate this volatile market in 2025. Below are our model portfolios, and the YTD performance for each:

If you are interested in trying TA Capital Research for free, we would love the chance to work with you! You can visit TACapitalResearch.com/Plans to learn more.
The information and analysis provided in this report are for informational purposes only and should not be construed as investment advice or a recommendation for any specific investment strategy, product, or service. Past performance is not indicative of future results, and all investments carry risks, including the potential loss of principal. TA Capital Research makes no representations or warranties regarding the accuracy or completeness of the information presented and does not assume any responsibility for any decisions made based on this report.
Reply